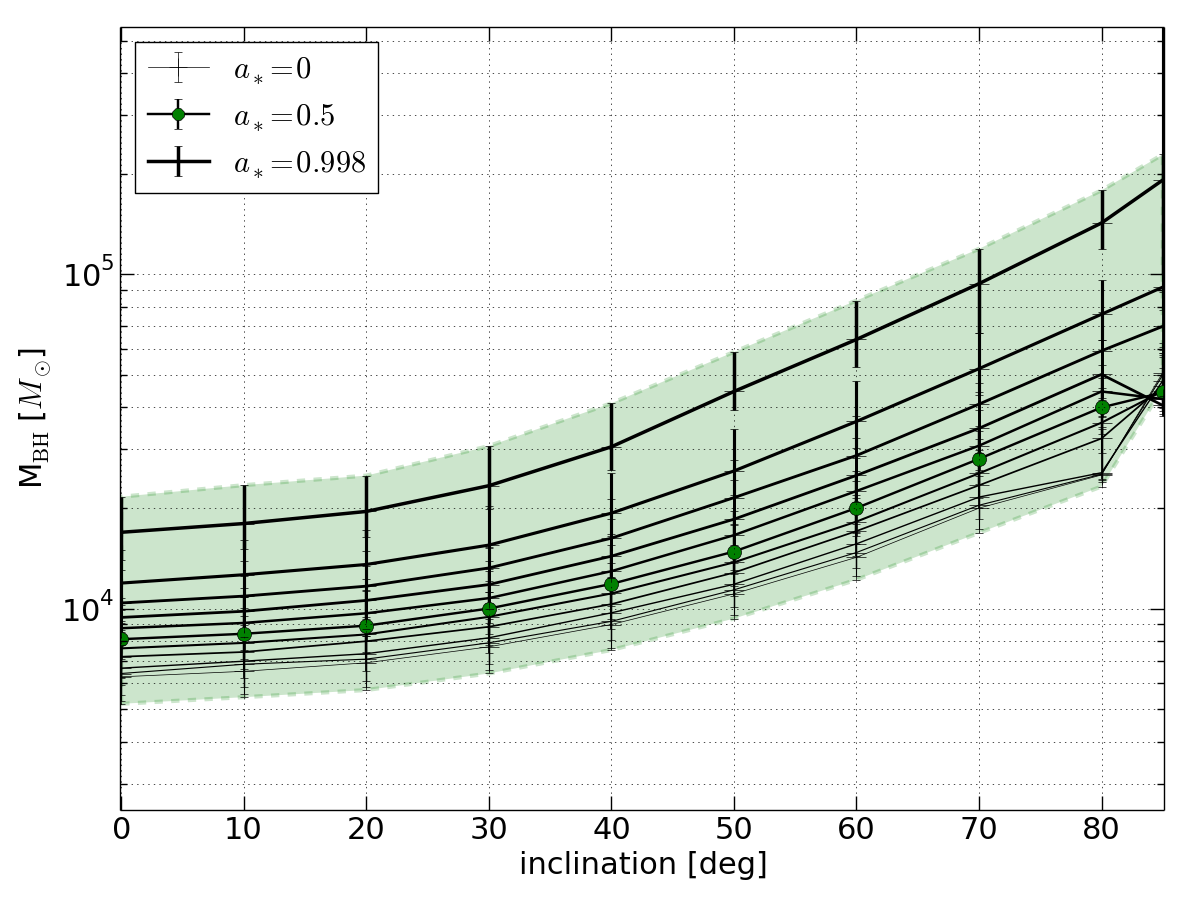
Fig. 3
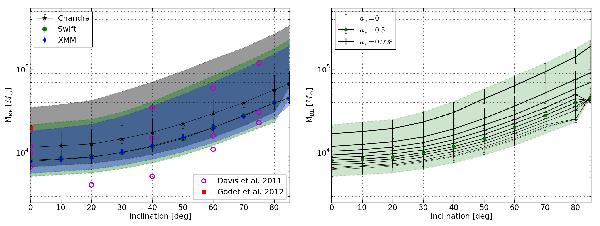
The black hole mass in HLX-1. Left: the shaded areas indicate the 90% confidence interval for the mass estimation of the Chandra (grey), Swift (green), and XMM (blue) spectrum, respectively, given for the whole spin range. The three solid lines represent the black hole mass that corresponds to the spin a∗ = 0.5 (where the error bars denote 90% confidence). The filled and open circles show previous mass measurements (see text for details). Right: the influence of spin on the mass estimation is shown for the Swift data. Error bars give the 90% confidence interval.
Current usage metrics show cumulative count of Article Views (full-text article views including HTML views, PDF and ePub downloads, according to the available data) and Abstracts Views on Vision4Press platform.
Data correspond to usage on the plateform after 2015. The current usage metrics is available 48-96 hours after online publication and is updated daily on week days.
Initial download of the metrics may take a while.