Fig. 5
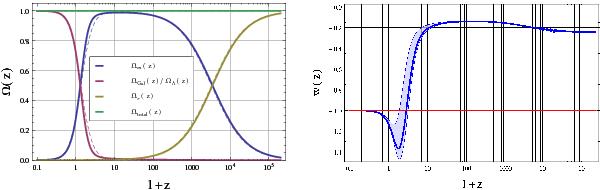
Evolution of the Ωi(z)
(left) and of w(z)
(right, solid curve) for the best-fit disformally coupled Galileon
model from all data (last row of Table 6). In
the left plot, dashed lines correspond to our ΛCDM best-fit values. Differences in
the radiation era are only due to different best-fit values of h. In the
right plot, the shaded area was obtained varying the
 parameters within their 1σ uncertainties, taking their correlations
into account.
parameters within their 1σ uncertainties, taking their correlations
into account.
Current usage metrics show cumulative count of Article Views (full-text article views including HTML views, PDF and ePub downloads, according to the available data) and Abstracts Views on Vision4Press platform.
Data correspond to usage on the plateform after 2015. The current usage metrics is available 48-96 hours after online publication and is updated daily on week days.
Initial download of the metrics may take a while.