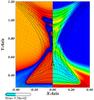
Fig. 10
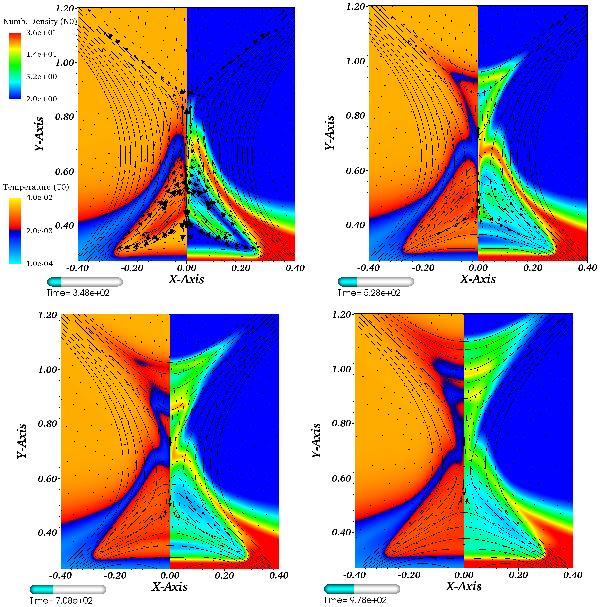
Evolution in time of the reconnection site behind the CME flux rope in a stratified atmosphere. Each panel shows a snapshot of the temperature structure on the left, the density structure on the right, select contours of the magnetic flux ψ (the same contour values, denoting the same magnetic field lines, have been chosen for each panel), and arrows denoting the in-plane plasma flow. The snapshots are made 348τ = 42 min, 528τ = 64 min, 708τ = 86 min, and 978τ = 118 min into the simulation. Note that for illustration purposes both plasma temperature and number density are plotted using logarithmic color scales with saturated high and low values. Arrows showing the plasma flow have been scaled by a factor of 25 with respect to the linear dimensions of the domain so that an arrow of unit length corresponds to flow of 1.7 × 10⁴ km s-1.
Current usage metrics show cumulative count of Article Views (full-text article views including HTML views, PDF and ePub downloads, according to the available data) and Abstracts Views on Vision4Press platform.
Data correspond to usage on the plateform after 2015. The current usage metrics is available 48-96 hours after online publication and is updated daily on week days.
Initial download of the metrics may take a while.