Fig. 7
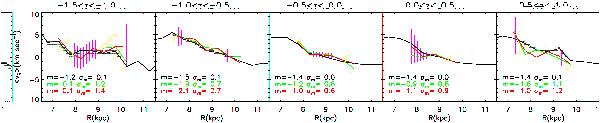
As in Fig. 4, but with the long bar. Note that in this case, the simulation has been mirrored with respect to the z = 0 plane, which implies that the black curves in the 2nd and 5th, and in the 3rd and 4th panels are identical. However, the RAVE selection function does depend on Galactic latitude, resulting in different blue and red curves in each panel.
Current usage metrics show cumulative count of Article Views (full-text article views including HTML views, PDF and ePub downloads, according to the available data) and Abstracts Views on Vision4Press platform.
Data correspond to usage on the plateform after 2015. The current usage metrics is available 48-96 hours after online publication and is updated daily on week days.
Initial download of the metrics may take a while.