Fig. 4
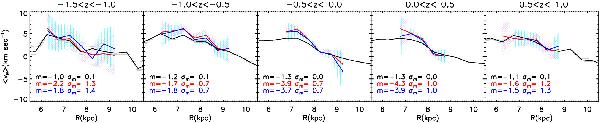
Average cylindrical radial velocity  as a function of
radial distance in the plane R, for particles inside a sphere of radius
3 kpc, when the Sun is
placed at (R,φ,z) = (8
kpc, −20°,0) and
for the default bar model. The bin size is 0.5 kpc. Each panel corresponds to
particles in a certain range of z. The black curve corresponds to the whole
sample and the error bands are the statistical error on the mean. The other two
curves represent the sample after the application of the RAVE selection function,
without (red line) and with (blue line) error convolution. The quantities
represented by the red and blue curves are averaged over 100 random subsamples of the
simulation. The error bands correspond to the maximum error on the mean amongst the
different samples. We only show the bins with errors smaller than 5 km s-1 and more than
50 particles.
as a function of
radial distance in the plane R, for particles inside a sphere of radius
3 kpc, when the Sun is
placed at (R,φ,z) = (8
kpc, −20°,0) and
for the default bar model. The bin size is 0.5 kpc. Each panel corresponds to
particles in a certain range of z. The black curve corresponds to the whole
sample and the error bands are the statistical error on the mean. The other two
curves represent the sample after the application of the RAVE selection function,
without (red line) and with (blue line) error convolution. The quantities
represented by the red and blue curves are averaged over 100 random subsamples of the
simulation. The error bands correspond to the maximum error on the mean amongst the
different samples. We only show the bins with errors smaller than 5 km s-1 and more than
50 particles.
Current usage metrics show cumulative count of Article Views (full-text article views including HTML views, PDF and ePub downloads, according to the available data) and Abstracts Views on Vision4Press platform.
Data correspond to usage on the plateform after 2015. The current usage metrics is available 48-96 hours after online publication and is updated daily on week days.
Initial download of the metrics may take a while.