Fig. 3
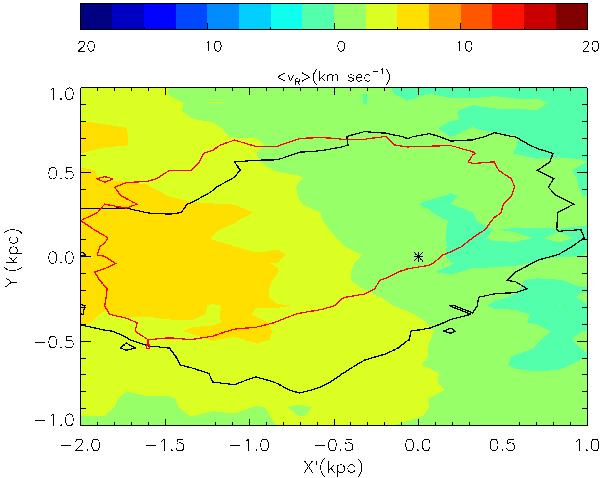
Trends in  as a function of
the cartesian coordinates (X′,Y′)
centered on the Sun, with the Galactic center at (X′,Y′)
= (−8 kpc,0). These are computed for particles
inside a sphere of radius 3
kpc, when the Sun is placed at (R,φ,z) = (8 kpc, −
20°,0) and for the default bar
model. The plotted data are averaged inside bins of 100 pc size in (X′,Y′),
box smoothed on a scale of 200
pc. The contours enclose 90% of particles with −1.5 kpc
<z<
0 (black) and 0
<z< 1.5
kpc (red), when the RAVE selection function is applied.
as a function of
the cartesian coordinates (X′,Y′)
centered on the Sun, with the Galactic center at (X′,Y′)
= (−8 kpc,0). These are computed for particles
inside a sphere of radius 3
kpc, when the Sun is placed at (R,φ,z) = (8 kpc, −
20°,0) and for the default bar
model. The plotted data are averaged inside bins of 100 pc size in (X′,Y′),
box smoothed on a scale of 200
pc. The contours enclose 90% of particles with −1.5 kpc
<z<
0 (black) and 0
<z< 1.5
kpc (red), when the RAVE selection function is applied.
Current usage metrics show cumulative count of Article Views (full-text article views including HTML views, PDF and ePub downloads, according to the available data) and Abstracts Views on Vision4Press platform.
Data correspond to usage on the plateform after 2015. The current usage metrics is available 48-96 hours after online publication and is updated daily on week days.
Initial download of the metrics may take a while.