Free Access
Fig. 10
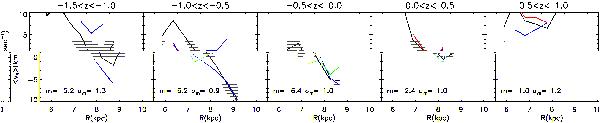
As in Fig. 4, but for the RAVE red clump stars used in W13. The shaded areas represent the measurement errors, the blue line the results obtained with the UCAC3 proper motions, the red line the results obtained with the SPM4 proper motions (see W13).
Current usage metrics show cumulative count of Article Views (full-text article views including HTML views, PDF and ePub downloads, according to the available data) and Abstracts Views on Vision4Press platform.
Data correspond to usage on the plateform after 2015. The current usage metrics is available 48-96 hours after online publication and is updated daily on week days.
Initial download of the metrics may take a while.