Fig. 1
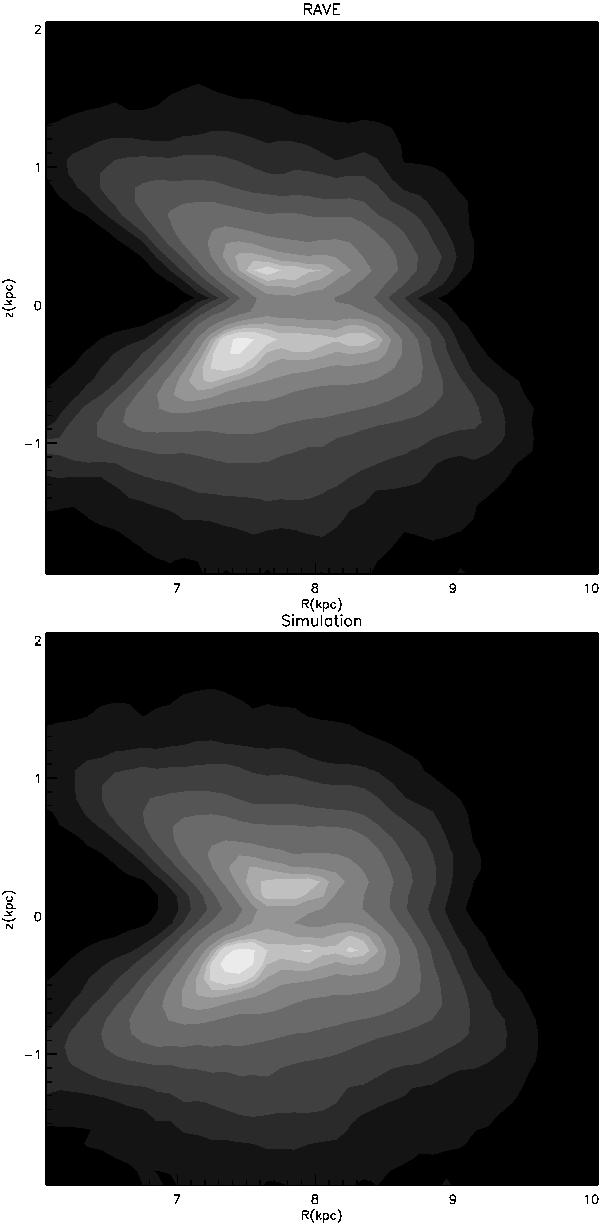
(R,z) distribution of stars in the RAVE sample used in W13 (top) and in the simulation with default Sun’s position after the application of the RAVE selection function (bottom). The contours enclose 2,6,12,21,33,50,68,80,90,95 and 99% of the stars.

Current usage metrics show cumulative count of Article Views (full-text article views including HTML views, PDF and ePub downloads, according to the available data) and Abstracts Views on Vision4Press platform.
Data correspond to usage on the plateform after 2015. The current usage metrics is available 48-96 hours after online publication and is updated daily on week days.
Initial download of the metrics may take a while.