Fig. 9
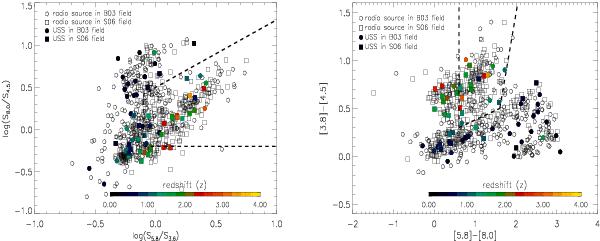
Mid-IR color–color diagnostic plots for our USS sources in both the B03 and S06 fields. Left and right panels show mid-IR color–color plots based on Lacy et al. (2004) and Stern et al. (2005) criteria, respectively. Filled and open symbols represent USS sources and 1.4 GHz radio populations, respectively. USS sources of different redshifts are shown with different colors. The regions bounded by dashed lines denotes AGN selection wedge. Lacy et al. (2004) defined the AGN selection wedge as: (log(S5.8/S3.6) > −0.1) ∧ (log(S8.0/S4.5) > −0.8) ∧ (log(S8.0/S4.5) ≤ 0.8 log(S5.8/S3.6) + 0.5); where ∧ is “AND” operator. While, the AGN selection wedge proposed by Stern et al. (2005) is defined as: ([5.8] – [8.0] > 0.6) ∧ ([3.6] – [4.5] > 0.2([5.8] – [8.0]) + 0.18) ∧ ([3.6] – [4.5 ] > 2.5 ([5.8]–[8.0]) – 3.5); where IRAC magnitudes are in the Vega system. We converted IRAC AB magnitudes to Vega magnitudes (mAB = mVega + conv) using conversion factors 2.78, 3.26, 3.75, and 4.38 for 3.6 μm, 4.5 μm, 5.8 μm, and 8.0 μm bands, respectively (see IRAC Data HandBook 3.0 2006).
Current usage metrics show cumulative count of Article Views (full-text article views including HTML views, PDF and ePub downloads, according to the available data) and Abstracts Views on Vision4Press platform.
Data correspond to usage on the plateform after 2015. The current usage metrics is available 48-96 hours after online publication and is updated daily on week days.
Initial download of the metrics may take a while.