Fig. 8
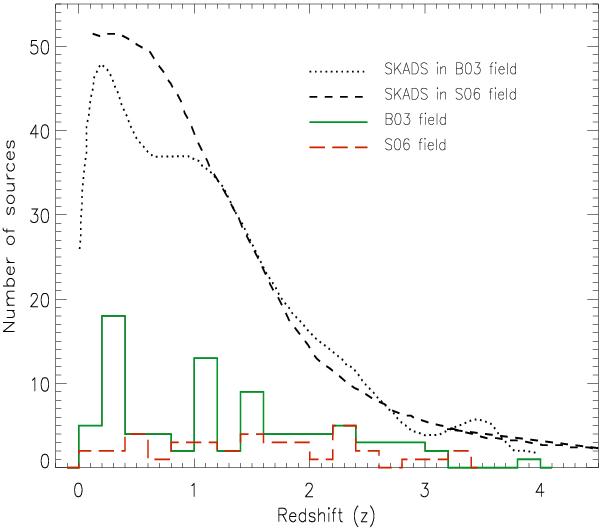
Redshift distributions of our USS sources in the B03 field (in green solid lines) and in the S06 field (in red dashed lines). Redshift estimates are available for 86/116 and 39/44 USS sources in the B03 field and the S06 field, respectively. The redshift distributions of 1.4 GHz radio population predicted by SKA simulated skies (SKADS; Wilman et al. 2008, 2010) for the B03 and the S06 fields are plotted with dotted and dashed curves, respectively. The flux limit S1.4 GHz ~ 100 μJy and sky area of 1.0 deg-2 in the B03 field and 0.8 deg-2 in the S06 field are used to obtain simulated radio populations for the two subfields, respectively. The redshift distributions of simulated radio populations in the B03 and the S06 fields are presented in McAlpine et al. (2013) and Simpson et al. (2012), respectively. The uneven variations seen in the SKADS simulated redshift distribution in the B03 field can be attributed to the clustering of radio sources manifested as cosmic variance in this relatively small field.
Current usage metrics show cumulative count of Article Views (full-text article views including HTML views, PDF and ePub downloads, according to the available data) and Abstracts Views on Vision4Press platform.
Data correspond to usage on the plateform after 2015. The current usage metrics is available 48-96 hours after online publication and is updated daily on week days.
Initial download of the metrics may take a while.