Fig. 2
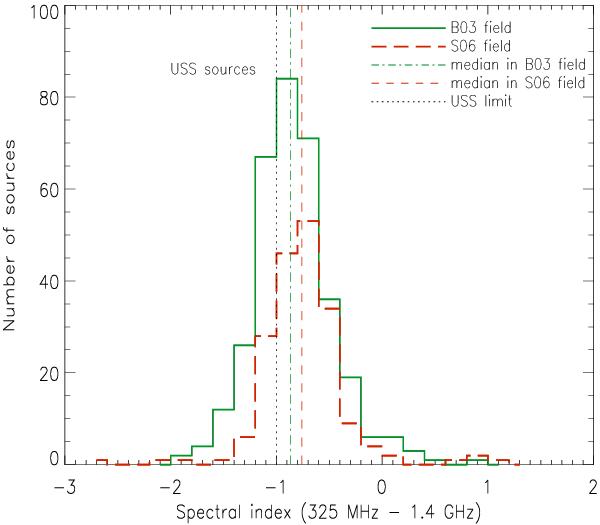
Histogram of 325 MHz to 1.4 GHz spectral index
( ).
Green solid line histogram represents sources in the B03 field while red dashed line
histogram represents sources in the S06 field. Median spectral indices in the B03
field (
).
Green solid line histogram represents sources in the B03 field while red dashed line
histogram represents sources in the S06 field. Median spectral indices in the B03
field ( ) and in the S06 field
(
) and in the S06 field
( ) are represented by
vertical green dashed-dotted and red dashed lines, respectively. USS limit
(
) are represented by
vertical green dashed-dotted and red dashed lines, respectively. USS limit
( )
is represented by the vertical dotted line.
)
is represented by the vertical dotted line.
Current usage metrics show cumulative count of Article Views (full-text article views including HTML views, PDF and ePub downloads, according to the available data) and Abstracts Views on Vision4Press platform.
Data correspond to usage on the plateform after 2015. The current usage metrics is available 48-96 hours after online publication and is updated daily on week days.
Initial download of the metrics may take a while.