Fig. 13
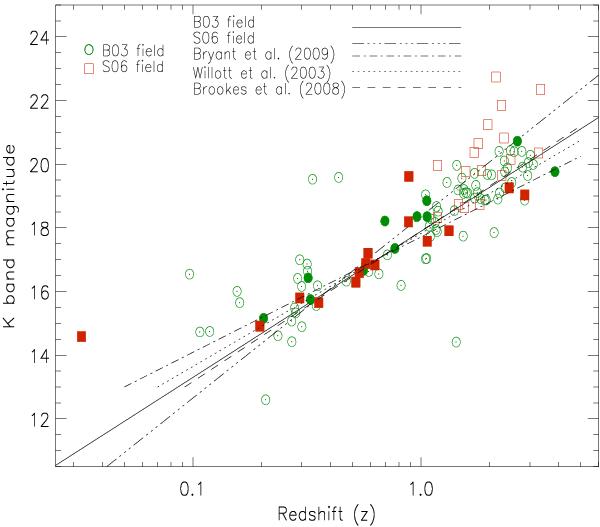
K − z plot for our USS sources. Green circles and red squares represent sources in the B03 and the S06 fields, respectively. Filled and open symbols represent sources with the spectroscopic and the photometric redshifts, respectively. Solid and dashed-triple-dotted lines represent the best fits for sources at redshifts (z) ≥ 0.5 in the B03 and the S06 fields, respectively. The dashed-dotted, dotted and dashed lines represent best fit lines of the K − z relations for the powerful radio galaxy samples from Bryant et al. (2009); Willott et al. (2003); Brookes et al. (2008), respectively. All the magnitudes are in Vega system.
Current usage metrics show cumulative count of Article Views (full-text article views including HTML views, PDF and ePub downloads, according to the available data) and Abstracts Views on Vision4Press platform.
Data correspond to usage on the plateform after 2015. The current usage metrics is available 48-96 hours after online publication and is updated daily on week days.
Initial download of the metrics may take a while.