Fig. 12
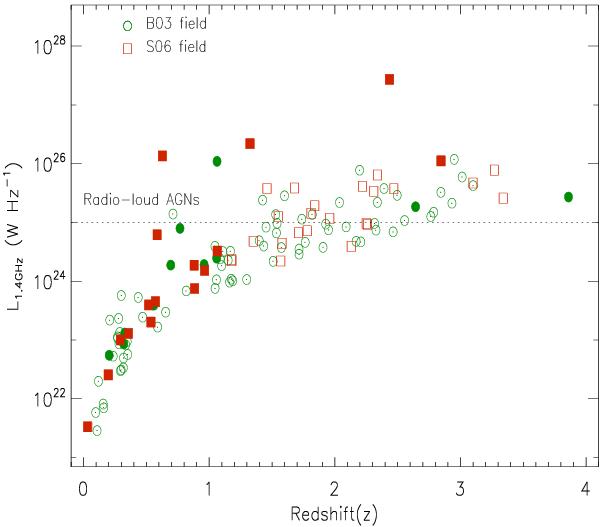
Redshift versus 1.4 GHz luminosity plot for our USS sample sources. Green circles and red squares represent sources in the B03 and the S06 fields, respectively. Filled and open symbols represent sources with the spectroscopic and the photometric redshifts, respectively. The dotted line shows the radio-loud limit (adopted from Jiang et al. 2007; Sajina et al. 2008).
Current usage metrics show cumulative count of Article Views (full-text article views including HTML views, PDF and ePub downloads, according to the available data) and Abstracts Views on Vision4Press platform.
Data correspond to usage on the plateform after 2015. The current usage metrics is available 48-96 hours after online publication and is updated daily on week days.
Initial download of the metrics may take a while.