Fig. 10
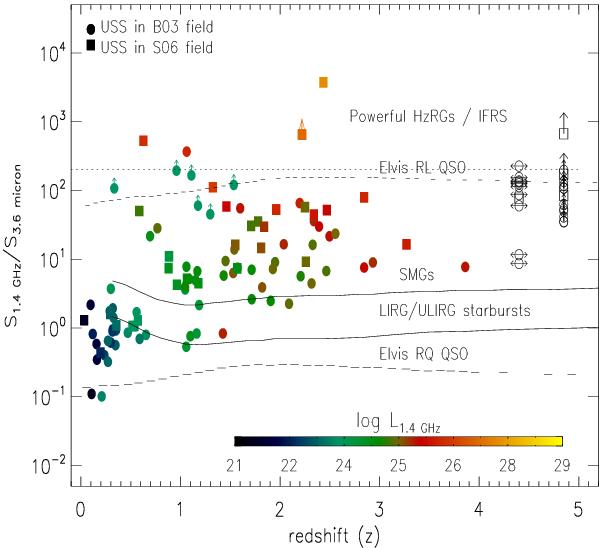
Ratio of 1.4 GHz radio flux density to 3.6 μm flux (S1.4 GHz/S3.6 μm) versus redshift plot for our USS sources. USS sources of different radio luminosities are represented with different colors. USS sources without redshift estimates are shown at the rightmost position. USS sources with only lower limits on the flux ratios (S1.4 GHz/S3.6 μm), i.e.,without 3.6 μm detections, are shown by upward arrows. The area above the dotted line represents the range of flux ratios for the powerful HzRGs and IFRSs. Tracks indicating the regions for the different classes of sources are taken from Norris et al. (2011a). The solid lines represent the loci of LIRGs and ULIRGs using Rieke et al. (2009) SED templates. The dashed (long dashed) line indicates the loci of radio-loud (radio-quiet) QSOs from Elvis et al. (1994). We caution that dust extinction can cause any of these tracks to rise steeply at high redshift where the observed 3.6 μm is emitted in visible wavelengths at the rest frame.
Current usage metrics show cumulative count of Article Views (full-text article views including HTML views, PDF and ePub downloads, according to the available data) and Abstracts Views on Vision4Press platform.
Data correspond to usage on the plateform after 2015. The current usage metrics is available 48-96 hours after online publication and is updated daily on week days.
Initial download of the metrics may take a while.