Fig. 7
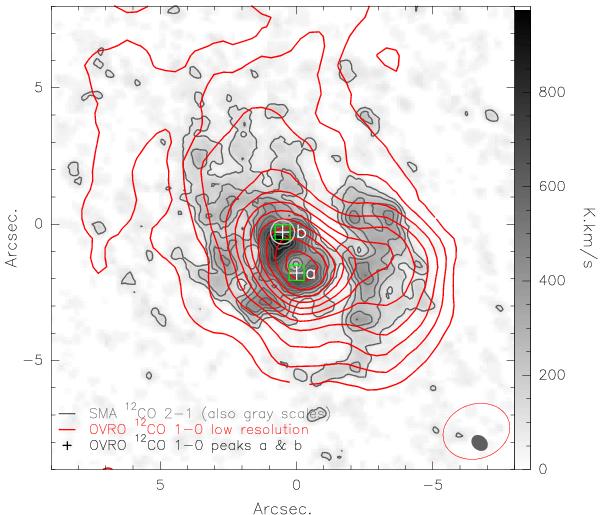
Comparison of the SMA 12CO 2−1 emission (gray scales) with OVRO 12CO 1−0 low resolution data (Aalto & Hüttemeister 2000). The beam sizes are indicated in the lower right corner. White crosses mark the positions of peaks “a” and “b” found by Aalto & Hüttemeister (2000) in their high resolution data, squares represent the CO peaks located in the dust lane and the circle marks the peak position with a counterpart in Hα (Armus et al. 1990).
Current usage metrics show cumulative count of Article Views (full-text article views including HTML views, PDF and ePub downloads, according to the available data) and Abstracts Views on Vision4Press platform.
Data correspond to usage on the plateform after 2015. The current usage metrics is available 48-96 hours after online publication and is updated daily on week days.
Initial download of the metrics may take a while.