Fig. 6
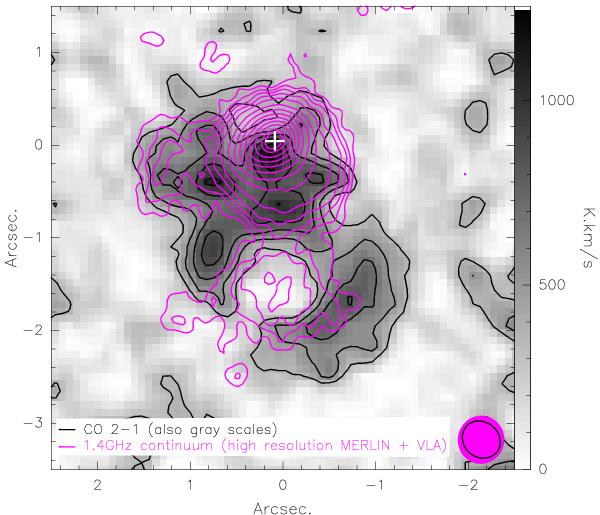
Comparison of the high-resolution CO 2−1 emission with the high-resolution 1.4 GHz emission in the central region of the Medusa. Black contours and gray scale background represent the higher resolution CO 2−1 emission (0.43′′ × 0.38′′). The high-resolution combined MERLIN and VLA data are represented by magenta contours. The cross marks the position of the 1.4 GHz radio continuum peak of the MERLIN observations by Beswick et al. (2005). The beam sizes are depicted, according to the color schemes, in the lower right corner.
Current usage metrics show cumulative count of Article Views (full-text article views including HTML views, PDF and ePub downloads, according to the available data) and Abstracts Views on Vision4Press platform.
Data correspond to usage on the plateform after 2015. The current usage metrics is available 48-96 hours after online publication and is updated daily on week days.
Initial download of the metrics may take a while.