Fig. 5
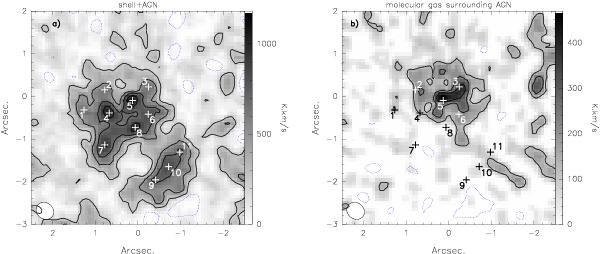
Distribution of the central CO 2−1 emission in high resolution (left) and intensity distribution of the gas surrounding the AGN, which is associated only with the second velocity component in the CO 2−1 spectrum (right). Crosses and numbers from 1 to 11 mark the positions of the GMAs. GMA 5 is located at the peak position of the 1.4 GHz radio continuum (Beswick et al. 2005). The beam (0.43′′ × 0.38′′) is shown in the lower left corner of the panels. The contours are at every 1.0 Jy km s-1 starting at 1.0 Jy km s-1; blue dotted contours are the negative counterparts of the lowest positive contour.
Current usage metrics show cumulative count of Article Views (full-text article views including HTML views, PDF and ePub downloads, according to the available data) and Abstracts Views on Vision4Press platform.
Data correspond to usage on the plateform after 2015. The current usage metrics is available 48-96 hours after online publication and is updated daily on week days.
Initial download of the metrics may take a while.