Fig. 3
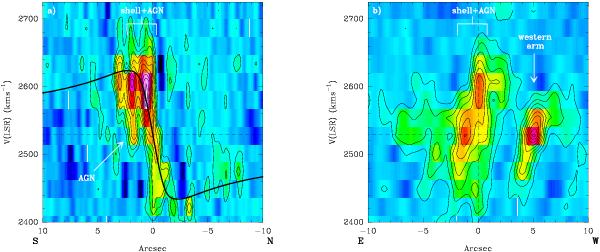
CO 2−1 position-velocity diagrams along the major (north-south, left) and the minor (east-west, right) axes of the NGC 4194 obtained from the high-resolution data cube within a slit width of 1′′. The contour levels start at 1.5σ in steps of 1.5σ. The colors range from 0 to 0.1 mJy/beam. The result of the fitted Brandt rotation curve, using a fixed inclination value of 40°, is shown on the left.
Current usage metrics show cumulative count of Article Views (full-text article views including HTML views, PDF and ePub downloads, according to the available data) and Abstracts Views on Vision4Press platform.
Data correspond to usage on the plateform after 2015. The current usage metrics is available 48-96 hours after online publication and is updated daily on week days.
Initial download of the metrics may take a while.