Fig. 2
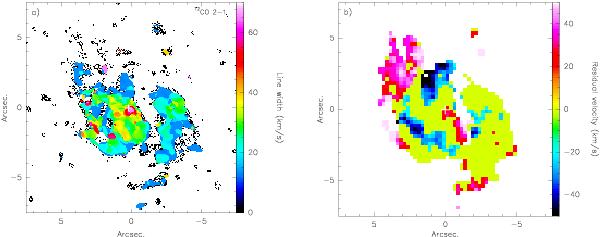
Velocity dispersion map of the high-resolution CO 2−1 emission (left). Map showing the residuals in the velocity field after the subtraction of the rotation curve from the CO velocity field (right). Residuals in the range ±20 km s-1, which corresponds to the noise limit in the residuals map, are plotted in light green; regions with values larger than that are depicted in red (positive values) and blue (negative values). The white crosses mark the peak position of the radio continuum from Beswick et al. (2005).
Current usage metrics show cumulative count of Article Views (full-text article views including HTML views, PDF and ePub downloads, according to the available data) and Abstracts Views on Vision4Press platform.
Data correspond to usage on the plateform after 2015. The current usage metrics is available 48-96 hours after online publication and is updated daily on week days.
Initial download of the metrics may take a while.