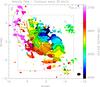
Fig. 1
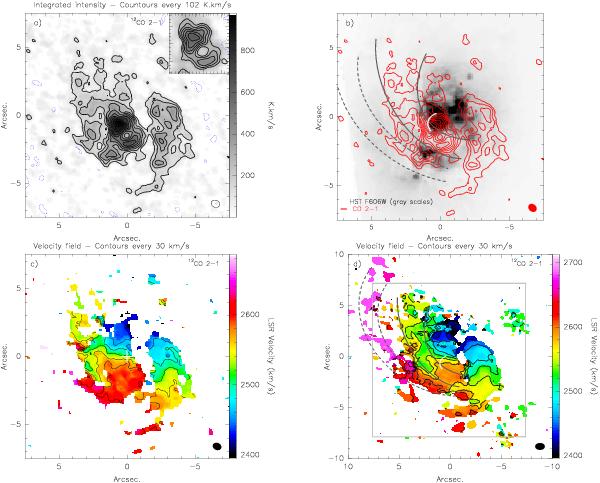
Integrated intensity map (upper left) and velocity field (bottom left) of the high resolution CO 2−1 emission (0.65′′ × 0.52′′), velocity field of the low resolution CO 2−1 emission (bottom right, 0.95′′ × 0.68′′) in NGC 4194, and an overlay of the high resolution 12CO 2−1 emission contours on top of an HST WFPC2 F606W filter image (top right). The noise level in the integrated intensity map is 1.3 Jy km s-1. Contours for the integrated intensity map start at 2σ in steps of 2σ; the first negative contour at −2σ is shown as a dotted contour. The velocity range plotted in the velocity field is between 2400 km s-1 and 2700 km s-1; contours range from 2400 km s-1 to 2640 km s-1. The gray, gray-dashed, and white curves in the HST overlay and lower-resolution velocity field represent the locations of the most important dust lanes. The solid line box in the lower-resolution velocity field represents the field-of-view shown in the higher-resolution velocity field. North is up, east to the left. The position of the 1.4 GHz continuum peak is marked by a white cross (Beswick et al. 2005).
Current usage metrics show cumulative count of Article Views (full-text article views including HTML views, PDF and ePub downloads, according to the available data) and Abstracts Views on Vision4Press platform.
Data correspond to usage on the plateform after 2015. The current usage metrics is available 48-96 hours after online publication and is updated daily on week days.
Initial download of the metrics may take a while.