Free Access
Fig. 4
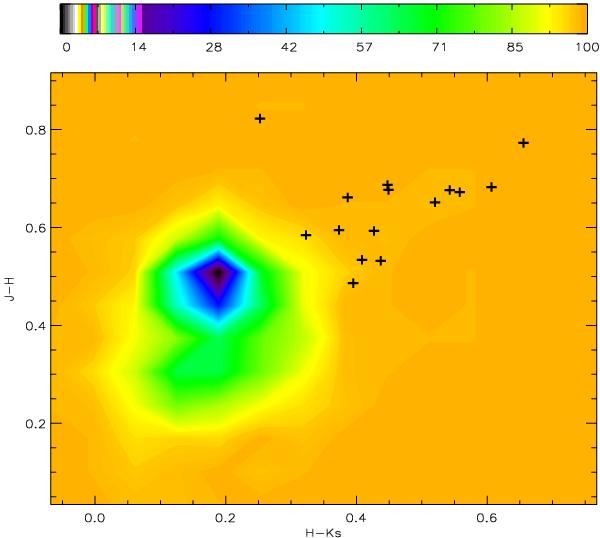
Color–color diagram J − H versus H − KS. The density map shows the whole sample in the central region of the cluster (color scale corresponds to the percentage of objects with respect to the total number, as shown in the key). The crosses mark the red-sequence galaxies, as selected from Fig. 3.
Current usage metrics show cumulative count of Article Views (full-text article views including HTML views, PDF and ePub downloads, according to the available data) and Abstracts Views on Vision4Press platform.
Data correspond to usage on the plateform after 2015. The current usage metrics is available 48-96 hours after online publication and is updated daily on week days.
Initial download of the metrics may take a while.