Fig. 3
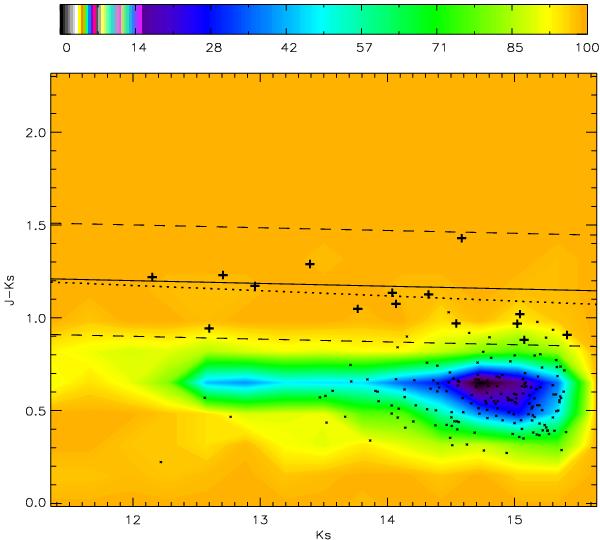
Color–magnitude diagram J − KS versus KS. The density map shows the whole sample in the central region of the cluster (color scale corresponds to the percentage of objects with respect to the total number, as shown in the key). The red-sequence model is represented by a solid line and the ± 5σ around the model by dashed lines. The dots correspond to the sources that met the selection criteria of Sect. 3.1. The crosses mark the red-sequence galaxies with visual confirmation. The red sequence, fitted to the bright galaxy cluster member candidates, is shown by the dotted line.
Current usage metrics show cumulative count of Article Views (full-text article views including HTML views, PDF and ePub downloads, according to the available data) and Abstracts Views on Vision4Press platform.
Data correspond to usage on the plateform after 2015. The current usage metrics is available 48-96 hours after online publication and is updated daily on week days.
Initial download of the metrics may take a while.