Fig. 7
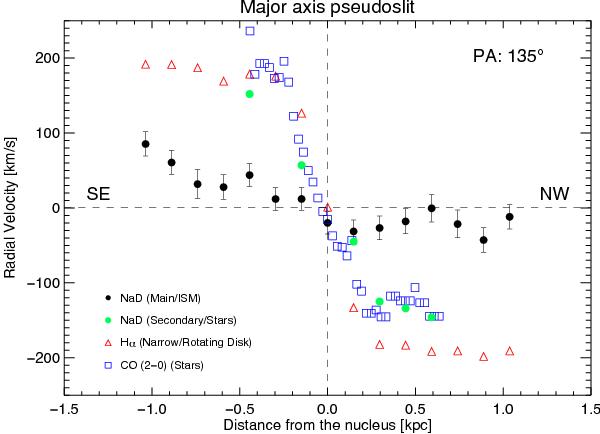
PV diagram along the major axis (PA ~ 135 degrees) for different tracers including NaD (the black and green circles indicate the main and the secondary components, respectively, see Sect. 3.1.1), narrow Hα (red triangles), and CO(2−0) (blue squares) data. Error bars are not displayed for the ionized gas, stars, and the NaD secondary component speeds since they are, typically, less than 15 km s-1, therefore smaller than the corresponding symbols. We note that we did not include the PV curve for the Hα-broad component since it is not observed along the major kinematic axis and it is likely tracing non-circular motions (Sect. 4.4).
Current usage metrics show cumulative count of Article Views (full-text article views including HTML views, PDF and ePub downloads, according to the available data) and Abstracts Views on Vision4Press platform.
Data correspond to usage on the plateform after 2015. The current usage metrics is available 48-96 hours after online publication and is updated daily on week days.
Initial download of the metrics may take a while.