Fig. 6
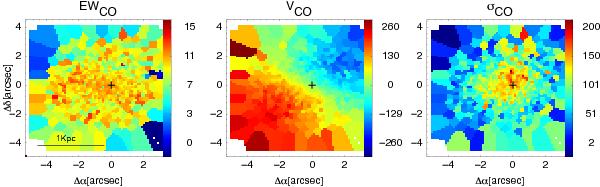
From left to right: equivalent width given in Å, velocity field and velocity dispersion (c) maps, represented in units of km s-1, of the stellar component in IRAS F11506-3851 as traced by the CO(2−0) λ2.293 μm infrared absorption line (Piqueras López et al., in prep.). The cross marks the nucleus (see Sect. 3.3). As mentioned in Sect. 3.2, data were binned using the adaptive Voronoi 2D-binning method, developed by Cappellari et al. (2004). We note that the ring-like structure with height Hα-EWs (Fig. 5) is absent in the EW(CO) map.
Current usage metrics show cumulative count of Article Views (full-text article views including HTML views, PDF and ePub downloads, according to the available data) and Abstracts Views on Vision4Press platform.
Data correspond to usage on the plateform after 2015. The current usage metrics is available 48-96 hours after online publication and is updated daily on week days.
Initial download of the metrics may take a while.