Fig. 5
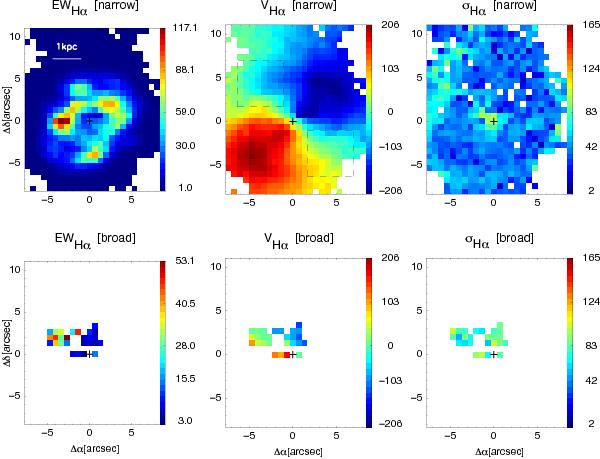
Ionized gas maps as derived from the Hα emission line profiles. First row: the equivalent width map, velocity field, and velocity dispersion map of the main (narrow) Hα component. Second row: the same as the first row but for the secondary (broad) component. EWs maps are in Å, while the kinematic maps are in km s-1. We note that these maps have been zoomed-in for consistency with the NaD maps. The cross marks the galaxy nucleus, as in Fig. 4. The black dashed boxes in the velocity map (narrow component) mark the regions where the integrated spectra are obtained and analyzed (see Sect. 4.4).
Current usage metrics show cumulative count of Article Views (full-text article views including HTML views, PDF and ePub downloads, according to the available data) and Abstracts Views on Vision4Press platform.
Data correspond to usage on the plateform after 2015. The current usage metrics is available 48-96 hours after online publication and is updated daily on week days.
Initial download of the metrics may take a while.