Fig. 4
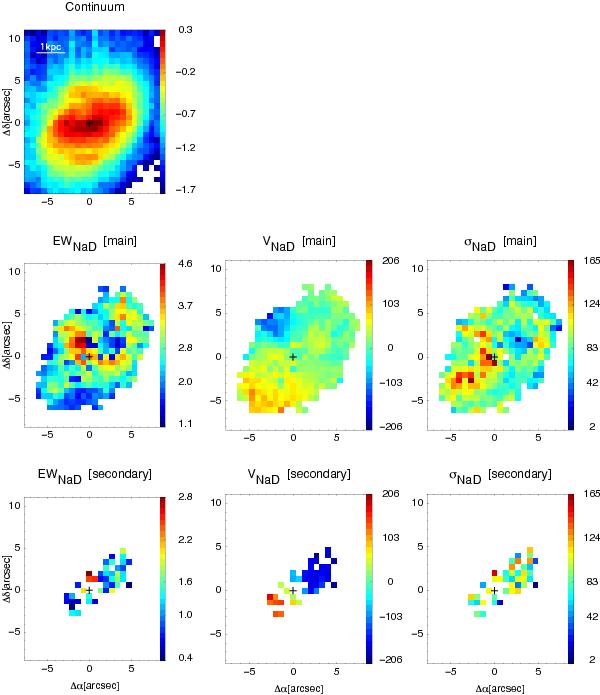
Neutral gas maps as derived from the NaD absorption line profiles. First row: optical continuum image (represented in logarithmic scale and in units of 10-13 erg s-1 cm-2) obtained from the mean of the line-free continuum nearby the doublet in a 100 Å restframe-wavelength range. Second row: the equivalent width map for the λ5890 line, velocity field, and velocity dispersion map for the main component. Third row: the same as the second row but for the secondary component. EWs maps are in Å, while the kinematic maps are in km s-1. The cross marks the galaxy nucleus (Sect. 3.3).
Current usage metrics show cumulative count of Article Views (full-text article views including HTML views, PDF and ePub downloads, according to the available data) and Abstracts Views on Vision4Press platform.
Data correspond to usage on the plateform after 2015. The current usage metrics is available 48-96 hours after online publication and is updated daily on week days.
Initial download of the metrics may take a while.