Fig. 3
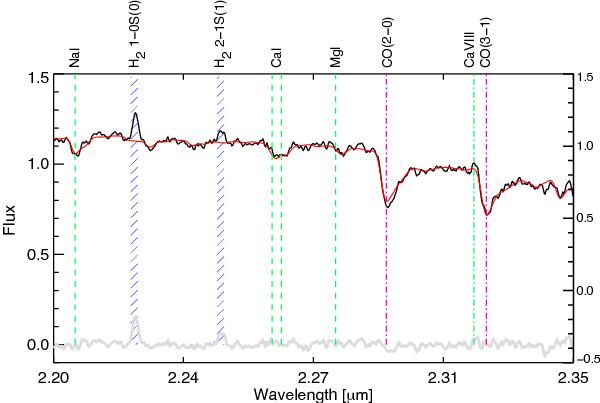
Near-IR spectrum (black) from the central bin (with S/N ~ 27) of IRAS F11506-3851 with overlaid its best-fitting template spectrum derived with the pPXF approach (Sect. 3.2) is shown (red line; fit residuals are shown in gray). The location of the wavelength bands masked during the fitting are marked in dark blue. The most relevant spectral features are labeled at the top and marked with a dashed green line, while the CO bands are marked with a magenta dotted-point line. The residuals from this process are low, typically within –0.1 and 0.2.
Current usage metrics show cumulative count of Article Views (full-text article views including HTML views, PDF and ePub downloads, according to the available data) and Abstracts Views on Vision4Press platform.
Data correspond to usage on the plateform after 2015. The current usage metrics is available 48-96 hours after online publication and is updated daily on week days.
Initial download of the metrics may take a while.