Fig. 2
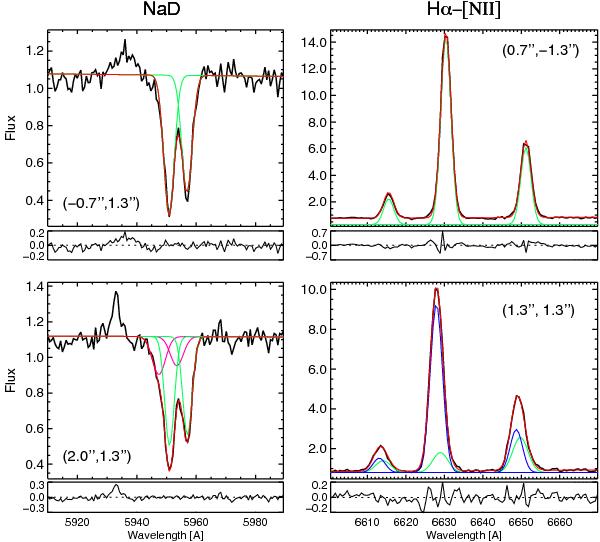
NaD (left) and Hα -[NII] (right) spectra for selected regions. In the labels the coordinates have been indicated as the distance from the nucleus (map center, Figs. 4 and 5). For each spaxel the modeled line profile (red line) and the single component (with different colors) are shown, along with the residuals (small panels). Top: the results of the NaD and the Hα one-component modeling. The green lines in each panel represent, respectively, the main-NaD and the narrow-Hα Gaussian functions. Bottom: examples of NaD and Hα spectra with two components. The secondary-NaD and the broad-Hα curves are shown in magenta and blue, respectively, and the green and red lines represent the main component and the global fits to the observed profiles (as in the top panels).
Current usage metrics show cumulative count of Article Views (full-text article views including HTML views, PDF and ePub downloads, according to the available data) and Abstracts Views on Vision4Press platform.
Data correspond to usage on the plateform after 2015. The current usage metrics is available 48-96 hours after online publication and is updated daily on week days.
Initial download of the metrics may take a while.