Fig. 10
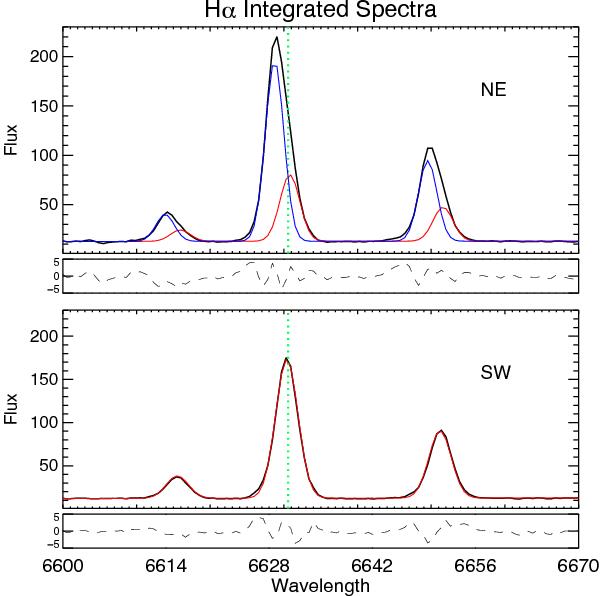
Hα line-profiles integrated spectra (black) in two different regions of 1.2 × 1.2 kpc along the minor axis (Fig. 5), respectively, towards the NE (top) and the SW (bottom). Below, the residuals (i.e., data – model) are also presented. Since the asymmetry of the observed profile the NEspectrum, two components are needed to properly fit the line profile. The narrow component is shown in red in both panels, while the broad one (likely due to outflowing gas) is shown in blue only in the NE spectrum (top). The systemic velocity is shown in green with a vertical dashed line, as reference.
Current usage metrics show cumulative count of Article Views (full-text article views including HTML views, PDF and ePub downloads, according to the available data) and Abstracts Views on Vision4Press platform.
Data correspond to usage on the plateform after 2015. The current usage metrics is available 48-96 hours after online publication and is updated daily on week days.
Initial download of the metrics may take a while.