Fig. 1
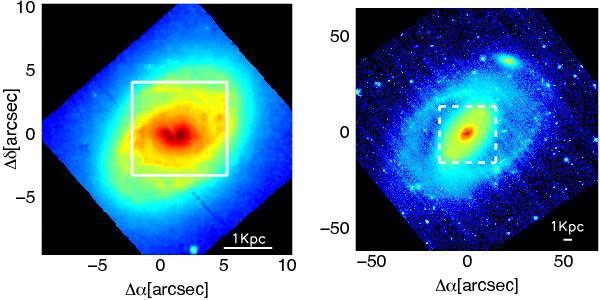
HST images of IRAS F11506-3851. The left panel shows the HST-NICMOS
(Near-Infrared Camera and Multi-Object Spectrometer) F160W image
(Alonso-Herrero et al. 2006), whereas the
right panel displays the HST-ACS (Advanced Camera for Surveys)
F814W image (Robishaw et al. 2008). Overlaid
are the SINFONI (9 ×
9,
left panel) and VIMOS (27×
27,
right panel) FoVs (the latter shown with dashed lines). We note
that the FoV covered by the NaD absorption (20×
17)
cover only the central region of the VIMOS FoV. See text for details. The white bar
shows a linear scale of 1 kpc (corresponding to
453
at the adopted distance, Table 1).
×
9,
left panel) and VIMOS (27×
27,
right panel) FoVs (the latter shown with dashed lines). We note
that the FoV covered by the NaD absorption (20×
17)
cover only the central region of the VIMOS FoV. See text for details. The white bar
shows a linear scale of 1 kpc (corresponding to
453
at the adopted distance, Table 1).
Current usage metrics show cumulative count of Article Views (full-text article views including HTML views, PDF and ePub downloads, according to the available data) and Abstracts Views on Vision4Press platform.
Data correspond to usage on the plateform after 2015. The current usage metrics is available 48-96 hours after online publication and is updated daily on week days.
Initial download of the metrics may take a while.