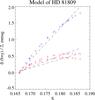
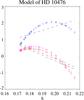
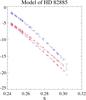
Fig. 8

Simulated values of the photometric brightness change δ(b + y)/2 as they would be measured from the equatorial plane (red crosses), at 57° inclination (magenta crosses), and from the stellar rotational axis (blue crosses) vs. S-index. Plotted are values for model stars with the activity level of HD 81809 (mean and rms variation values of S are equal to 0.1713 and 0.0080, left panel), of HD 10476 (0.1896 and 0.0136, middle panel), and of HD 82885 (0.2679 and 0.0186, right panel). The dashed lines correspond to the linear regressions calculated over the whole δ(b + y)/2 and S-index data sets.
Current usage metrics show cumulative count of Article Views (full-text article views including HTML views, PDF and ePub downloads, according to the available data) and Abstracts Views on Vision4Press platform.
Data correspond to usage on the plateform after 2015. The current usage metrics is available 48-96 hours after online publication and is updated daily on week days.
Initial download of the metrics may take a while.