Fig. 4
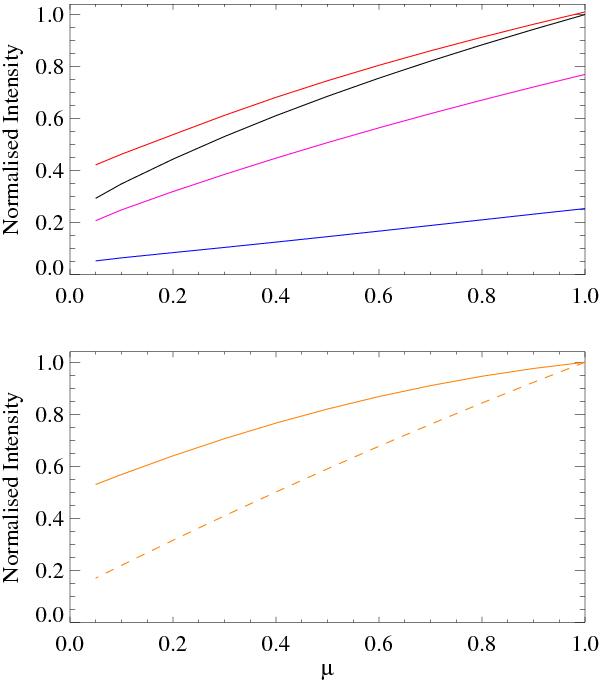
Upper panel: center-to-limb variation of the Strömgren (b + y)/2 intensity calculated for the quiet Sun, faculae, penumbra, and umbra models (black, red, magenta, and blue curves). Plotted are the ratios to the quiet-Sun intensity at the disk center. Lower panel: quadratic polynomial parameterization of the intensity center-to-limb variation at the Ca II K line and the nearby continuum (solid and dashed orange curves) according to Skumanich et al. (1984). Both intensities are normalized to unity at the disk center.
Current usage metrics show cumulative count of Article Views (full-text article views including HTML views, PDF and ePub downloads, according to the available data) and Abstracts Views on Vision4Press platform.
Data correspond to usage on the plateform after 2015. The current usage metrics is available 48-96 hours after online publication and is updated daily on week days.
Initial download of the metrics may take a while.