Fig. 3
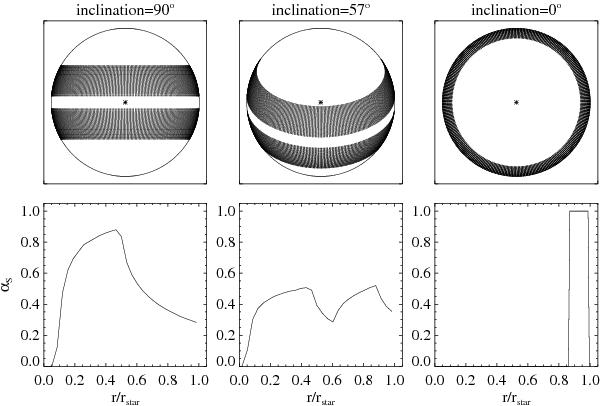
Upper panels: visible projections of two bands between latitudes ± 5° and ± 30° on the stellar disk for three inclination values. The bands correspond to the solar distribution of spots employed here. The star sign indicates the position of the disk center. Lower panels: the fractional coverage of the stellar disk by spots plotted as functions of the impact parameter r/rstar (which is 0 at the disk centrer and 1 at the limb). The fractional coverage is calculated assuming that the two bands plotted in the upper panels are completely covered by spots.
Current usage metrics show cumulative count of Article Views (full-text article views including HTML views, PDF and ePub downloads, according to the available data) and Abstracts Views on Vision4Press platform.
Data correspond to usage on the plateform after 2015. The current usage metrics is available 48-96 hours after online publication and is updated daily on week days.
Initial download of the metrics may take a while.