Fig. B.1
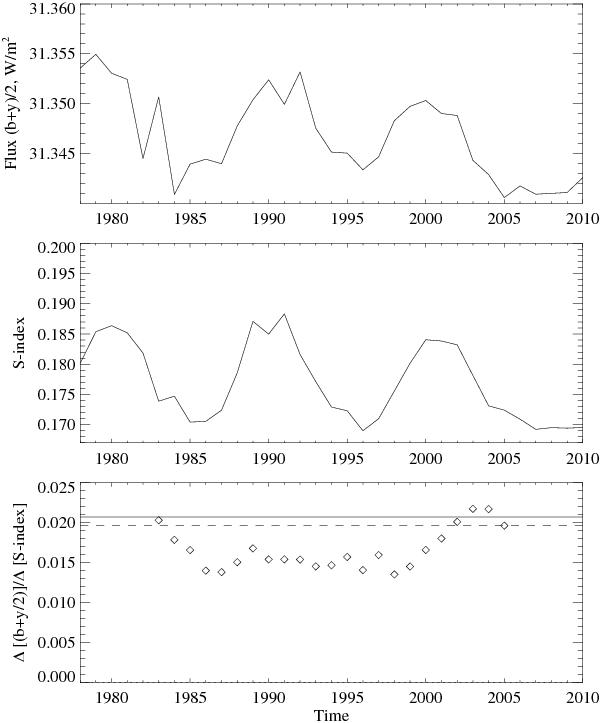
Annual values of the solar spectral flux in the Strömgren (b + y)/2 filters according to the SATIRE-S model (upper panel) and the S-index calculated from the Sac Peak measurements (middle panel) as well as the slopes of the activity-brightness correlation (lower panel). The solid line in the lower panel represents the slope calculated with the simplified model used in this paper, while the dashed line corresponds to the slope calculated with SATIRE-S data using the entire time series (1978–2010).
Current usage metrics show cumulative count of Article Views (full-text article views including HTML views, PDF and ePub downloads, according to the available data) and Abstracts Views on Vision4Press platform.
Data correspond to usage on the plateform after 2015. The current usage metrics is available 48-96 hours after online publication and is updated daily on week days.
Initial download of the metrics may take a while.