Fig. 11
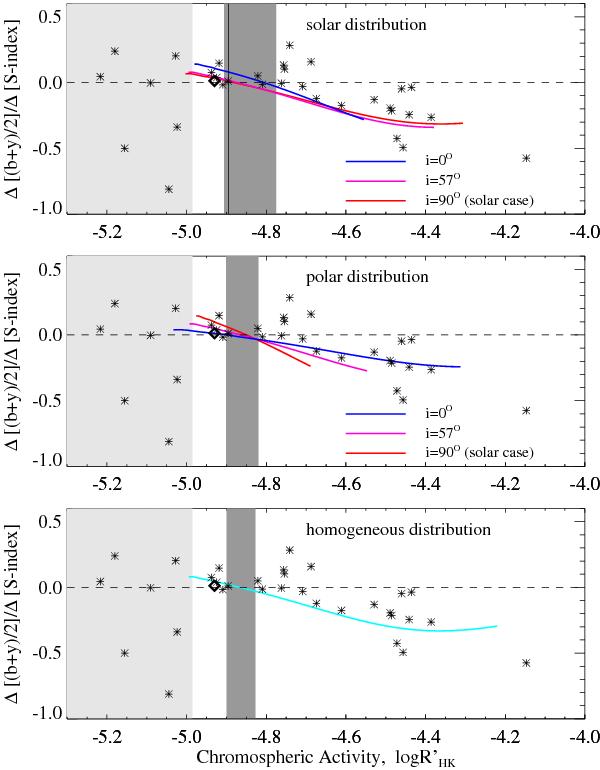
Regression slope of the dependence of photometric brightness variation on HK
emission variation, plotted vs. mean chromospheric activity
 for stars
with solar (upper panel), polar (middle panel),
and homogeneous (lower panel) active region distributions. The
asterisks indicate the observed values for the stellar sample of Lockwood et al. (2007). The diamond indicates 18
Scorpii (HD 146233) from Hall et al. (2009).
The light-shaded areas represent the activity levels for which the photometric
variability, according to the activity-variability regression from Lockwood et al. (2007), is smaller than the
1σ
uncertainty and thus Δ [
(b + y)/2 ]/ΔS values cannot be
reliably defined. Colored curves are the output of our model calculated for three
values of the stellar inclination: 90° (red curve), 57° (magenta curve), and
0° (blue
curve). The dashed lines separate facula-dominated (positive Δ [ (b + y)/2 ]/ΔS)
from spot-dominated (negative Δ [
(b + y)/2 ]/ΔS) variability. The solid
vertical line in the upper panel denotes the mean level of solar
chromospheric activity. The dark-shaded bands indicate the range of chromospheric
activities for which according to our model the stars can be observed as either
faculae- or spot-dominated, depending on the period of time over which they are
observed (see text for details).
for stars
with solar (upper panel), polar (middle panel),
and homogeneous (lower panel) active region distributions. The
asterisks indicate the observed values for the stellar sample of Lockwood et al. (2007). The diamond indicates 18
Scorpii (HD 146233) from Hall et al. (2009).
The light-shaded areas represent the activity levels for which the photometric
variability, according to the activity-variability regression from Lockwood et al. (2007), is smaller than the
1σ
uncertainty and thus Δ [
(b + y)/2 ]/ΔS values cannot be
reliably defined. Colored curves are the output of our model calculated for three
values of the stellar inclination: 90° (red curve), 57° (magenta curve), and
0° (blue
curve). The dashed lines separate facula-dominated (positive Δ [ (b + y)/2 ]/ΔS)
from spot-dominated (negative Δ [
(b + y)/2 ]/ΔS) variability. The solid
vertical line in the upper panel denotes the mean level of solar
chromospheric activity. The dark-shaded bands indicate the range of chromospheric
activities for which according to our model the stars can be observed as either
faculae- or spot-dominated, depending on the period of time over which they are
observed (see text for details).
Current usage metrics show cumulative count of Article Views (full-text article views including HTML views, PDF and ePub downloads, according to the available data) and Abstracts Views on Vision4Press platform.
Data correspond to usage on the plateform after 2015. The current usage metrics is available 48-96 hours after online publication and is updated daily on week days.
Initial download of the metrics may take a while.