Fig. 10
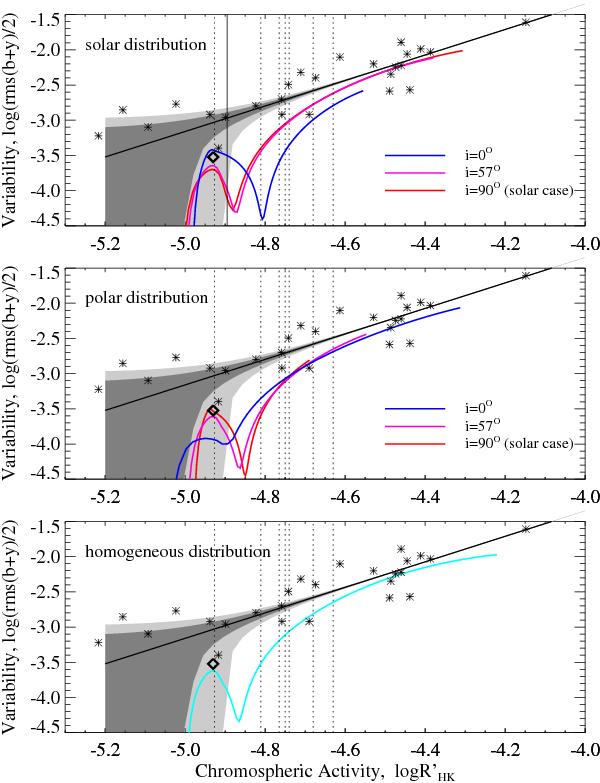
Comparison of the observed and modeled photometric variability. The modeled values of
the photometric variability are plotted vs. mean chromospheric activity for model
stars with solar (upper panel), polar (middle
panel), and homogeneous (lower panel) latitudinal
distributions of active regions. The asterisks and black lines indicate stars with
observed variability and the regression from Lockwood
et al. (2007). The dark (light) shaded areas indicate estimated
1σ
(2σ)
uncertainty in the Lockwood et al. (2007) data.
The diamond indicates 18 Scorpii (HD 146233) from Hall
et al. (2009). Colored curves result from our calculations for three values
of the stellar inclination: 90° (red curve), 57° (magenta curve),
0° (blue
curve). The dotted vertical lines denote the mean level of chromospheric activity of
stars with unconfirmed variability (only stars with
 are
shown). The solid vertical line in the top panel shows the mean level of solar
chromospheric activity.
are
shown). The solid vertical line in the top panel shows the mean level of solar
chromospheric activity.
Current usage metrics show cumulative count of Article Views (full-text article views including HTML views, PDF and ePub downloads, according to the available data) and Abstracts Views on Vision4Press platform.
Data correspond to usage on the plateform after 2015. The current usage metrics is available 48-96 hours after online publication and is updated daily on week days.
Initial download of the metrics may take a while.