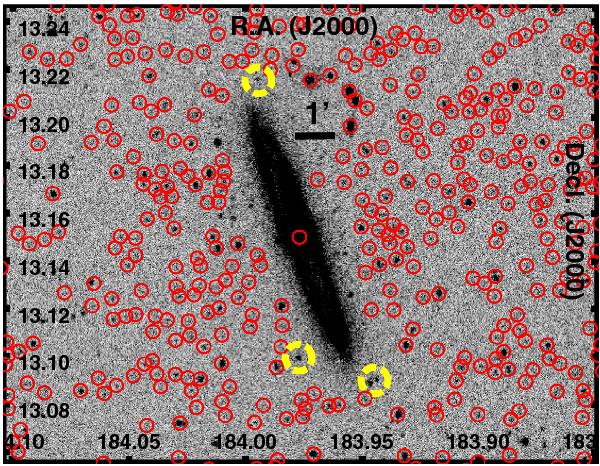
Fig. C.1

GALEX NUV image centered on VCC 167 (NGC 4216). The yellow dashed regions indicate the locations of known background sources from the SDSS, while the red regions are the GALEX pipeline catalog sources detected in this NUV image. This clearly demonstrates how the GALEX pipeline excludes source detections in a proximity to extended sources >1′ in diameter.
Current usage metrics show cumulative count of Article Views (full-text article views including HTML views, PDF and ePub downloads, according to the available data) and Abstracts Views on Vision4Press platform.
Data correspond to usage on the plateform after 2015. The current usage metrics is available 48-96 hours after online publication and is updated daily on week days.
Initial download of the metrics may take a while.


