Fig. 7
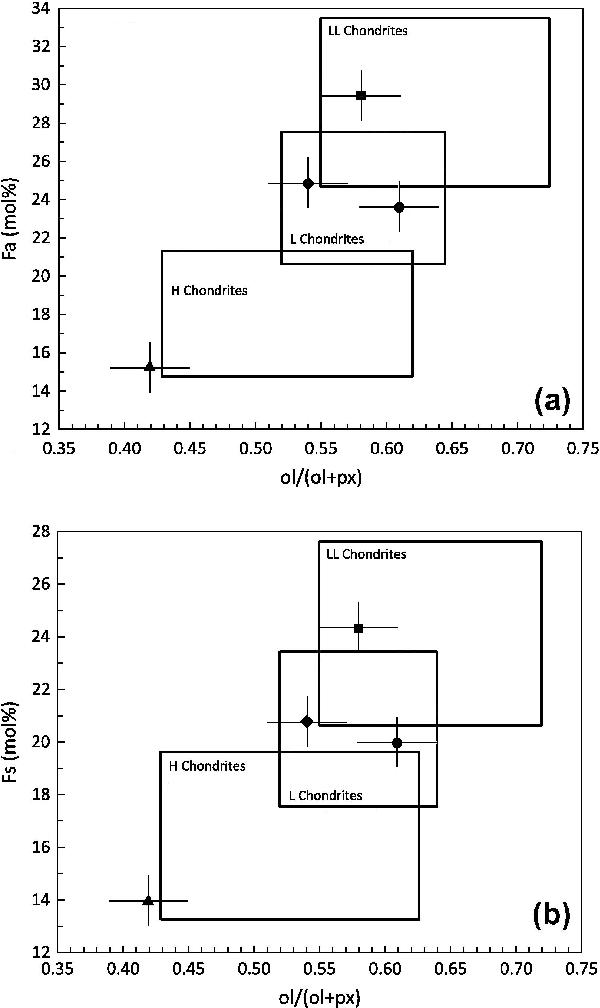
a) Spectrally derived mol% Fa and b) mol% Fs plotted as a function of derived ol/(ol+px) for (25916) 2001 CP44 (square), (85804) 1998 WQ5 (triangle), (164222) 2004 RN9 (circle), and 2004 TD10 (diamond). Solid boxes represent the range of spectrally derived ol/(ol+px) for H, L, and LL ordinary chondrites, together with error bars from Dunn et al. (2010). Error bars represent the least mean square of the errors (0.03 for ol/(ol + px), 1.3 mol% for Fa, and 1.4 mol% for Fs). Adapted from Dunn et al. (2013).
Current usage metrics show cumulative count of Article Views (full-text article views including HTML views, PDF and ePub downloads, according to the available data) and Abstracts Views on Vision4Press platform.
Data correspond to usage on the plateform after 2015. The current usage metrics is available 48-96 hours after online publication and is updated daily on week days.
Initial download of the metrics may take a while.