Fig. 8
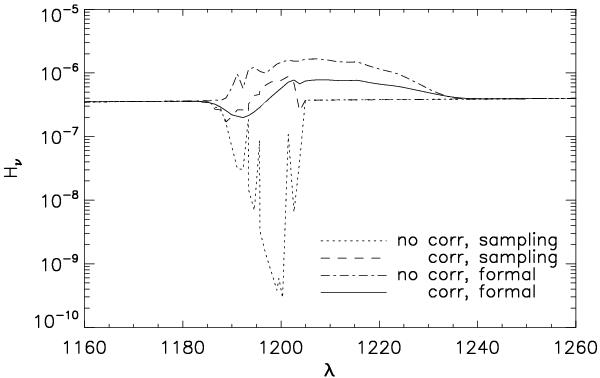
Emergent flux in the Lyman-α line of a Type II supernova model containing H and He. For better comparison, both models shown have been computed neglecting the contribution of H and He lines to the line blocking in all iterations except the last one. Thus, both models have very similar occupation numbers and temperature structures. The two lines indicated with “sampling” refer to the emergent flux in the last iteration using the opacity sampling technique. The other two lines represent the flux after the first iteration that uses the exact solution. The dotted line and the dash-dotted line belong to the model that uses the standard procedure in the solution of the Feautrier scheme; the dashed line and the solid line refer to the model that had the correction applied.
Current usage metrics show cumulative count of Article Views (full-text article views including HTML views, PDF and ePub downloads, according to the available data) and Abstracts Views on Vision4Press platform.
Data correspond to usage on the plateform after 2015. The current usage metrics is available 48-96 hours after online publication and is updated daily on week days.
Initial download of the metrics may take a while.