Fig. 5
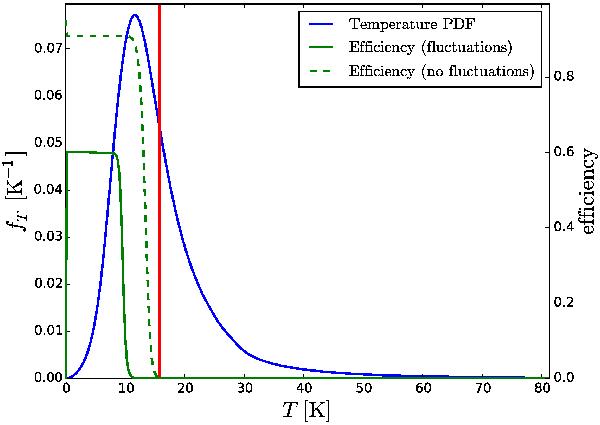
Temperature PDF (blue line, left axis) for a 3 nm carbonaceous dust grain, as compared to the formation efficiency (LH mechanism) as a function of temperature (green lines, right axis). The red vertical line marks the mean temperature of the blue PDF. The grain receives a G0 = 20 radiation field and is surrounded by a 100 K gas with nH = 104 cm-3. The energy values correspond to ices.
Current usage metrics show cumulative count of Article Views (full-text article views including HTML views, PDF and ePub downloads, according to the available data) and Abstracts Views on Vision4Press platform.
Data correspond to usage on the plateform after 2015. The current usage metrics is available 48-96 hours after online publication and is updated daily on week days.
Initial download of the metrics may take a while.