Fig. 6
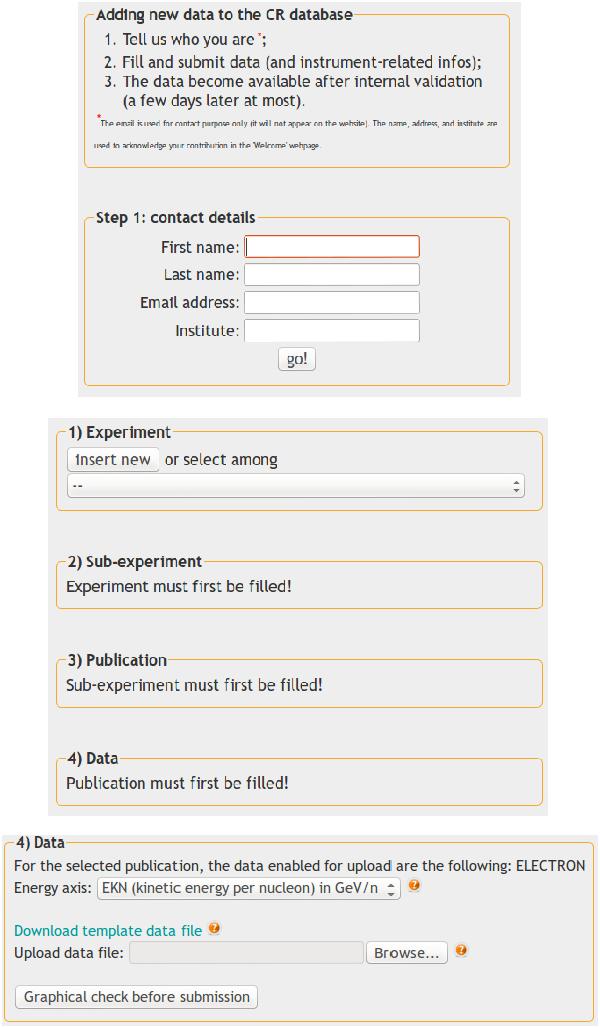
Snapshots of the user interfaces in the Add data tab. The first stage for adding new data is the submitter identification (upper panel). The ordered four-step submission process comes next (middle panel). The user has to either select among existing entries or insert a new one (this pops-up a window with fields to fill), which does not work for the fourth step that concerns the CR data. The latter must be filled one CR quantity at a time (and must belong to the list of quantities declared at the publication step): the bottom panel shows the state of the panel once this step is reached with the energy axis to select, the data file to upload, and the [Graphical check before submission]. We note that help buttons exist for most of the fields to fill at all steps.
Current usage metrics show cumulative count of Article Views (full-text article views including HTML views, PDF and ePub downloads, according to the available data) and Abstracts Views on Vision4Press platform.
Data correspond to usage on the plateform after 2015. The current usage metrics is available 48-96 hours after online publication and is updated daily on week days.
Initial download of the metrics may take a while.