Fig. 4
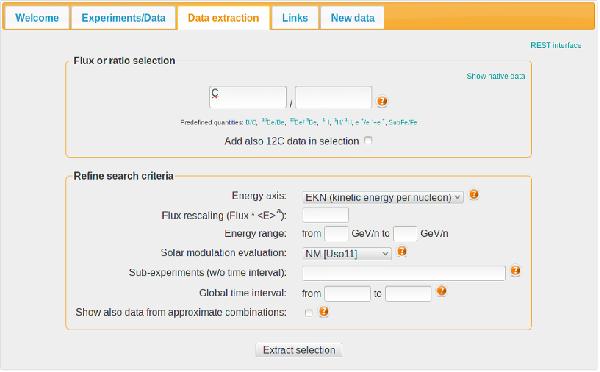
Snapshot of the Data extraction tab interface. In the upper panel, a CR quantity is chosen by means of selection boxes (auto completion enabled). In the lower panel, more search criteria are possible (energy range, list of experiments or sub-experiments, time period, etc.). The selector [Solar modulation evaluation] allows the user to choose which set of φ values (see Sect. 2.3) is displayed. A tick box allows to add in the search the data points obtained from combinations of “native” data (see Appendix A). Clicking on the [Extract selection] button pops up the results, as shown in the example Fig. 5.
Current usage metrics show cumulative count of Article Views (full-text article views including HTML views, PDF and ePub downloads, according to the available data) and Abstracts Views on Vision4Press platform.
Data correspond to usage on the plateform after 2015. The current usage metrics is available 48-96 hours after online publication and is updated daily on week days.
Initial download of the metrics may take a while.