Fig. 2
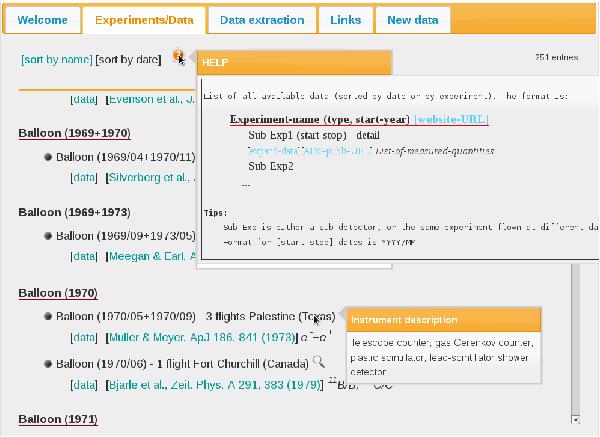
Snapshot of the Experiments/Data tab content (Sect. 3.1). The help box is activated by clicking on the [question mark] icon and a picture of the instrumental setup (not shown) pops-up when clicking on the [magnifying glass] icon. The Instrument description box appears for a mouse-over action on the sub-experiment name. A click on [data] pops-up a new window with the data entries and a summary of all the (sub-)experiment/publication informations (not shown).
Current usage metrics show cumulative count of Article Views (full-text article views including HTML views, PDF and ePub downloads, according to the available data) and Abstracts Views on Vision4Press platform.
Data correspond to usage on the plateform after 2015. The current usage metrics is available 48-96 hours after online publication and is updated daily on week days.
Initial download of the metrics may take a while.