Fig. 6
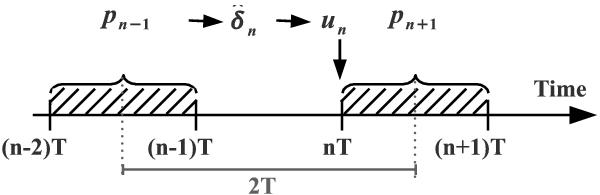
Representation of the simulated discretized time scheme. At iteration n, the OPDs  are estimated from the image In − 1 delivered at the end of the previous iteration, which is representative of piston disturbances Pn − 1 integrated between time steps n − 2 and n − 1. The corresponding correction on the delay lines Un is applied during the following iteration.
Current usage metrics show cumulative count of Article Views (full-text article views including HTML views, PDF and ePub downloads, according to the available data) and Abstracts Views on Vision4Press platform.
Data correspond to usage on the plateform after 2015. The current usage metrics is available 48-96 hours after online publication and is updated daily on week days.
Initial download of the metrics may take a while.