Fig. 2
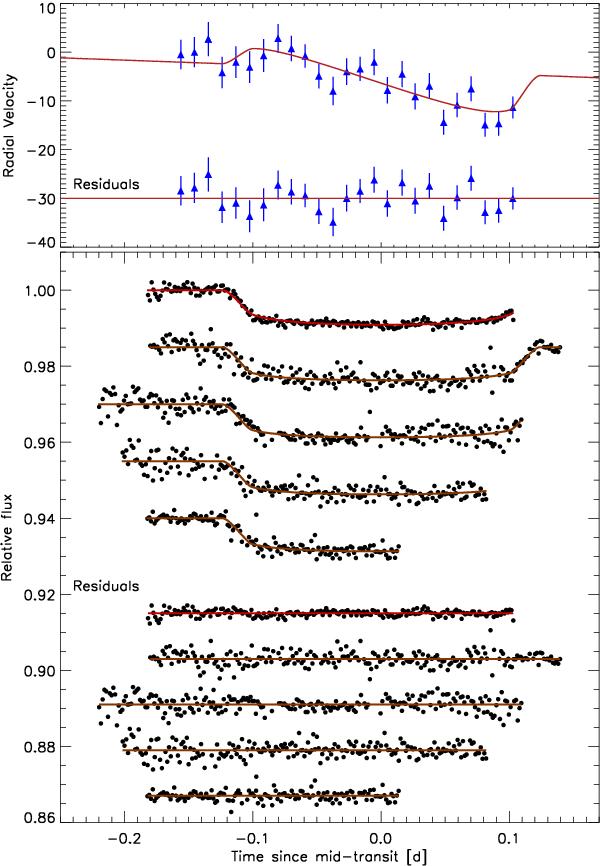
Top: HARPS RVs obtained on 29 Aug. 2013, during a transit of WASP-117b together with the best-fitting model and residuals. Bottom: transit lightcurves observed with (from top to bottom) EulerCam on 29 Aug. 2013, and TRAPPIST on 19 Aug. 2013, 29 Aug. 2013, 08 Sep. 2013, and 28 Sep. 2013 (all UT). The data are offset vertically for clarity. The lightcurves are corrected for their photometric baseline models, the best-fitting transit models are superimposed and the residuals shown below.
Current usage metrics show cumulative count of Article Views (full-text article views including HTML views, PDF and ePub downloads, according to the available data) and Abstracts Views on Vision4Press platform.
Data correspond to usage on the plateform after 2015. The current usage metrics is available 48-96 hours after online publication and is updated daily on week days.
Initial download of the metrics may take a while.