Fig. 1
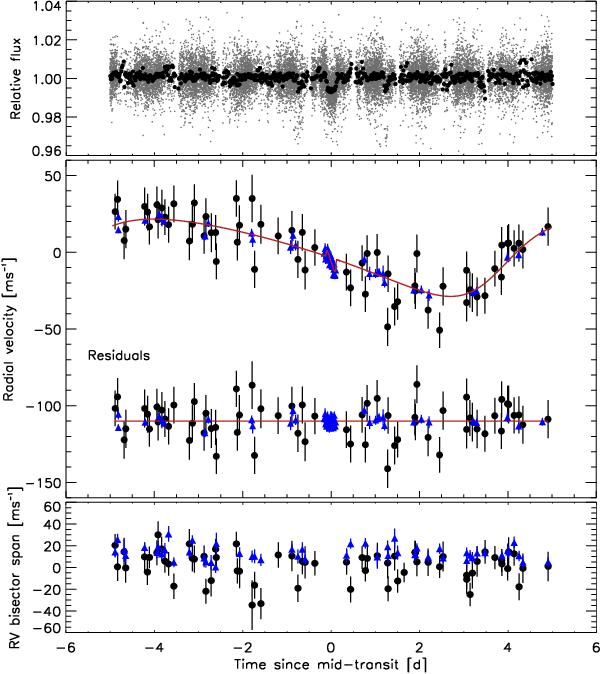
Top: WASP lightcurve of WASP-117 folded on the planetary period. All data are shown in gray, and the phase-folded data, binned into 20 min intervals, are shown in black. Middle: CORALIE (black circles) and HARPS (blue triangles) radial velocities folded on the planetary period together with the best-fitting model (red solid line) and residuals. Bottom: bisector spans of the above RV data.
Current usage metrics show cumulative count of Article Views (full-text article views including HTML views, PDF and ePub downloads, according to the available data) and Abstracts Views on Vision4Press platform.
Data correspond to usage on the plateform after 2015. The current usage metrics is available 48-96 hours after online publication and is updated daily on week days.
Initial download of the metrics may take a while.