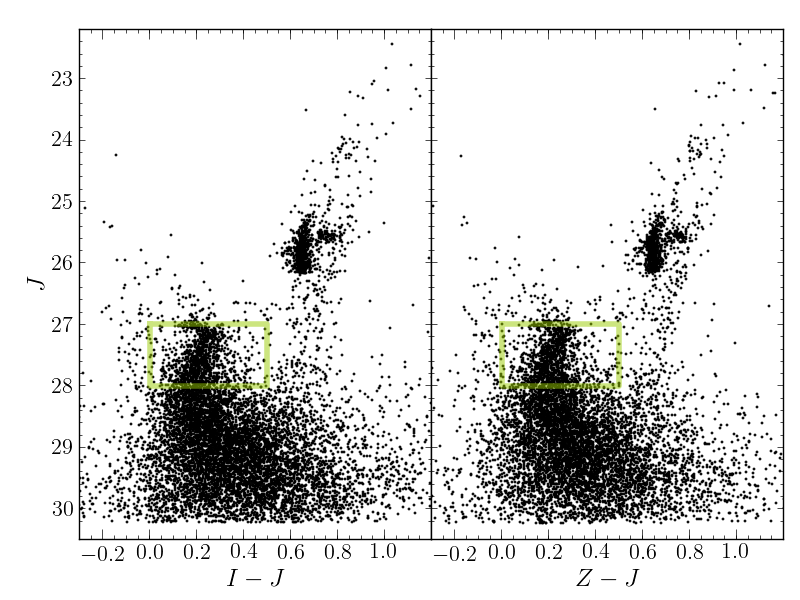
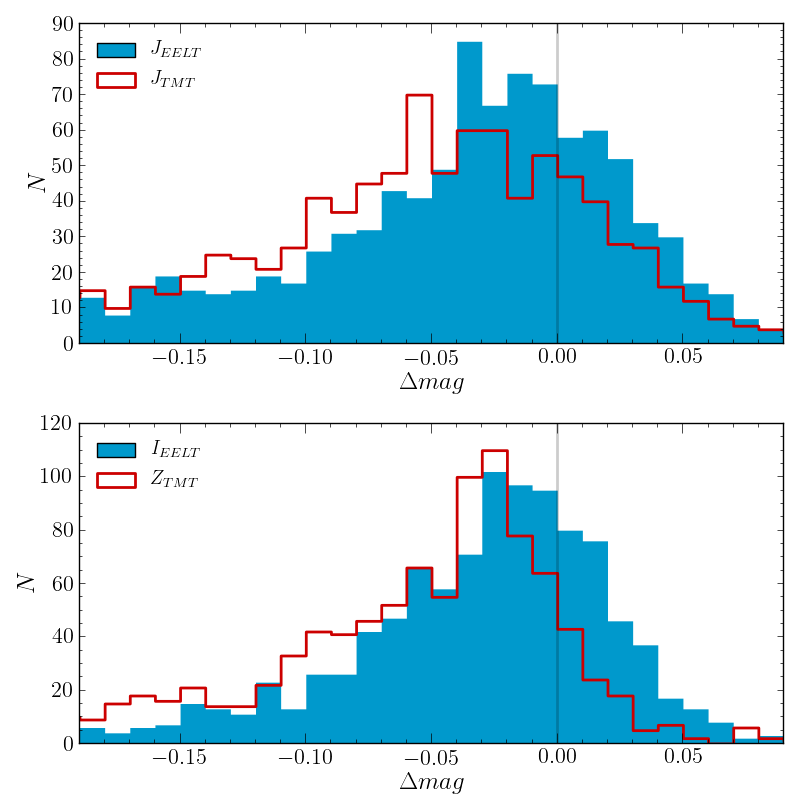
Fig. 9
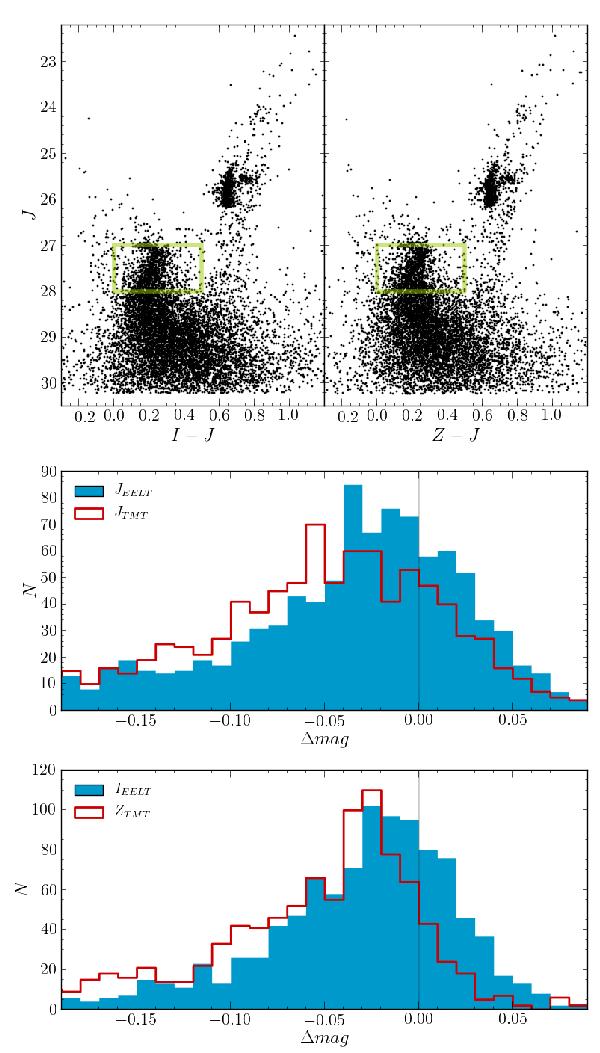
Top panels: CMDs for stars in the 4 <r/re< 6 region of MICADO (left panel) and IRIS (right panel) simulated images. The green rectangle shows the region selected for the comparison of the photometric errors shown in the panels below. Middle panel: photometric errors for MSTO stars in 4 <r/re< 6 region of J-band MICADO and IRIS image. Lower panel: the same for MICADO J and IRIS Z-band images. MSTO have been selected in the box shown in the top panels.
Current usage metrics show cumulative count of Article Views (full-text article views including HTML views, PDF and ePub downloads, according to the available data) and Abstracts Views on Vision4Press platform.
Data correspond to usage on the plateform after 2015. The current usage metrics is available 48-96 hours after online publication and is updated daily on week days.
Initial download of the metrics may take a while.