Fig. 6
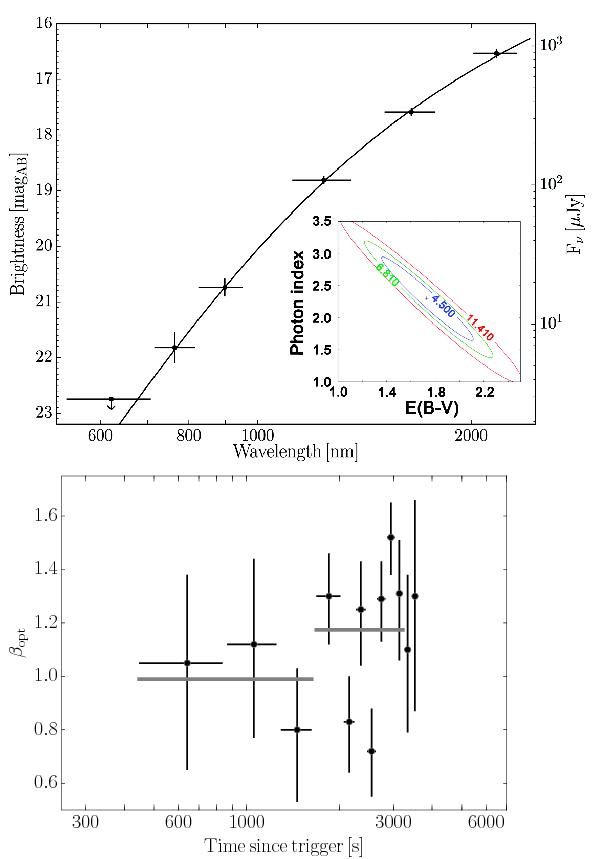
Top: spectral energy distribution of GRB 130925A during the optical/NIR peak as observed with GROND. The emission of the host galaxy is subtracted. There is no detection in the g′r′-bands above the host emission. The curvature in the SED is due to the strong dust extinction of AV = 5.0 ± 0.7 mag. The inset shows contours of constant χred for the intrinsic spectral slope as a function of reddening (SMC reddening law AV = 2.93 × E(B − V)) for the peak. Bottom: evolution of the spectral slope (spectral index β which relates to the photon index via β + 1) of the optical/NIR afterglow with time with fixed AV. For most temporal slices outside the optical/NIR peak, the spectral energy distribution is defined only through JHKs measurements, and thus the error is relatively large. The horizontal bars visualize the average slope for the peak (right) and the pre-peak (left) period.
Current usage metrics show cumulative count of Article Views (full-text article views including HTML views, PDF and ePub downloads, according to the available data) and Abstracts Views on Vision4Press platform.
Data correspond to usage on the plateform after 2015. The current usage metrics is available 48-96 hours after online publication and is updated daily on week days.
Initial download of the metrics may take a while.