Fig. 5
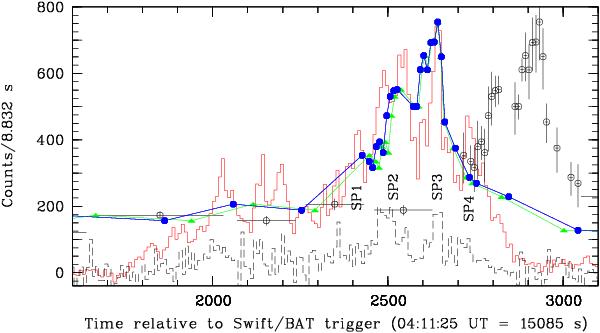
Expanded view of the delay of the GROND Ks-band light curve (open black symbols with error bars) with respect to the KW light curve (red line). In blue and green we show the shifted (−290 s) and stretched (time axis divided by 1.11) GROND Ks-band light curve, respectively. The black dashed curve at the bottom is the KW highest energy channel G3 (at a factor 3 stretched intensity scaling).
Current usage metrics show cumulative count of Article Views (full-text article views including HTML views, PDF and ePub downloads, according to the available data) and Abstracts Views on Vision4Press platform.
Data correspond to usage on the plateform after 2015. The current usage metrics is available 48-96 hours after online publication and is updated daily on week days.
Initial download of the metrics may take a while.