Free Access
Fig. 1
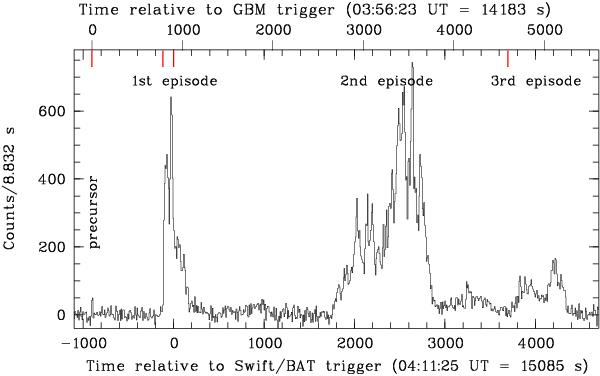
Background-subtracted light curve of the prompt emission of GRB 130925A as measured with Konus-Wind in the 26−1480 keV band. The red, thick vertical lines at the top indicate, in temporal sequence from the left, the first GBM trigger, the second GBM trigger, the BAT trigger and the MAXI trigger.
Current usage metrics show cumulative count of Article Views (full-text article views including HTML views, PDF and ePub downloads, according to the available data) and Abstracts Views on Vision4Press platform.
Data correspond to usage on the plateform after 2015. The current usage metrics is available 48-96 hours after online publication and is updated daily on week days.
Initial download of the metrics may take a while.